How to use
- Install from the Chrome Web Store
- Add your UAT domain
- Hard-reload the UAT tab
- Reproduce and download
- What “last N minutes” means
- Open the replay viewer
1 Install from the Chrome Web Store
Open the listing and click Add to Chrome:
Shadow Monitor on Chrome Web Store
Pin the extension from the puzzle-piece menu so the toolbar icon is easy to reach.
2 Add your UAT domain
Click the extension icon → open Settings (gear).
Under UAT environments, read the disclosure, check
I understand…, then type the hostname only (no https://, no path):
uat.example.com
Include the port when it is not 443, e.g. localhost:3000.
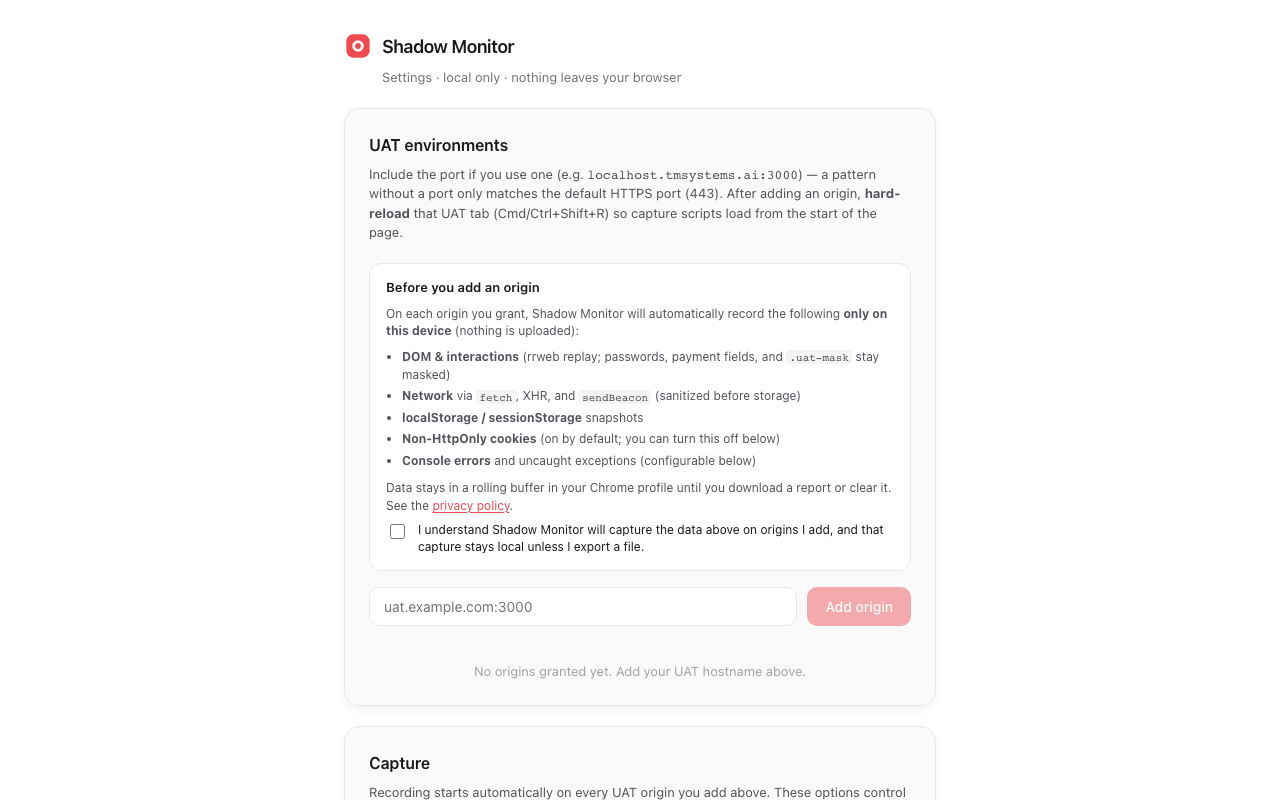
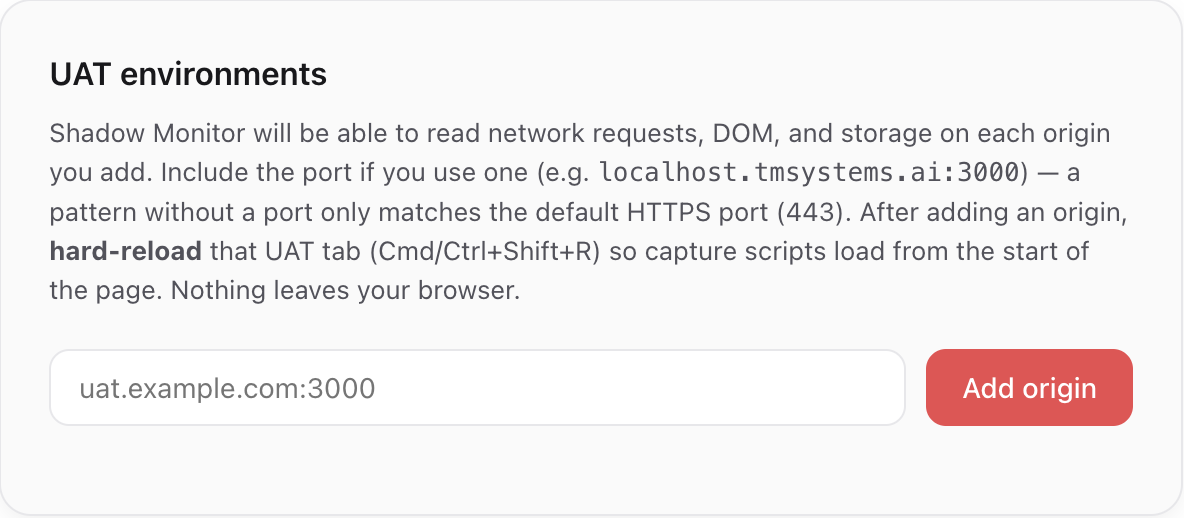
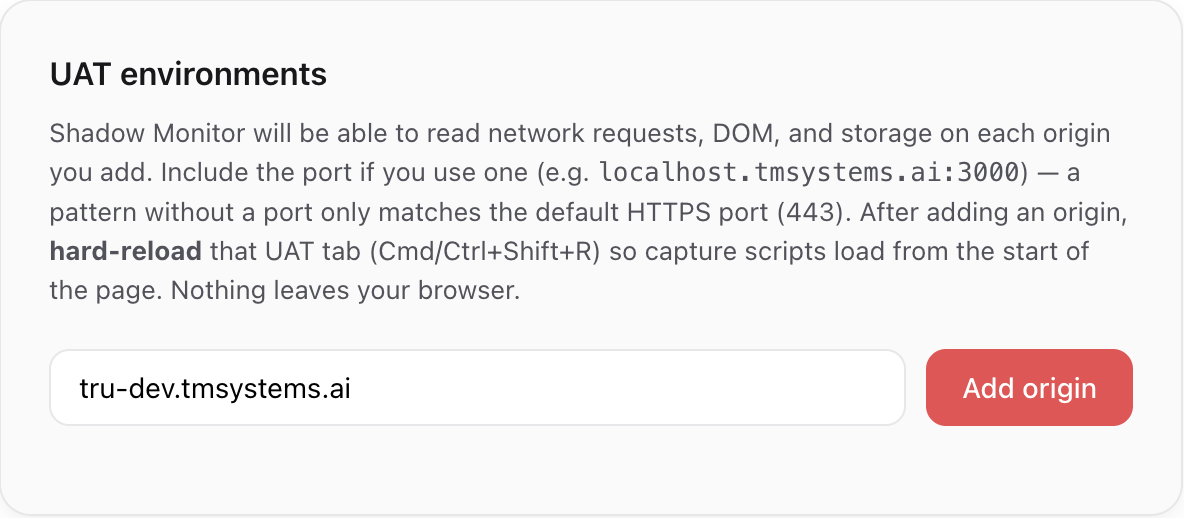
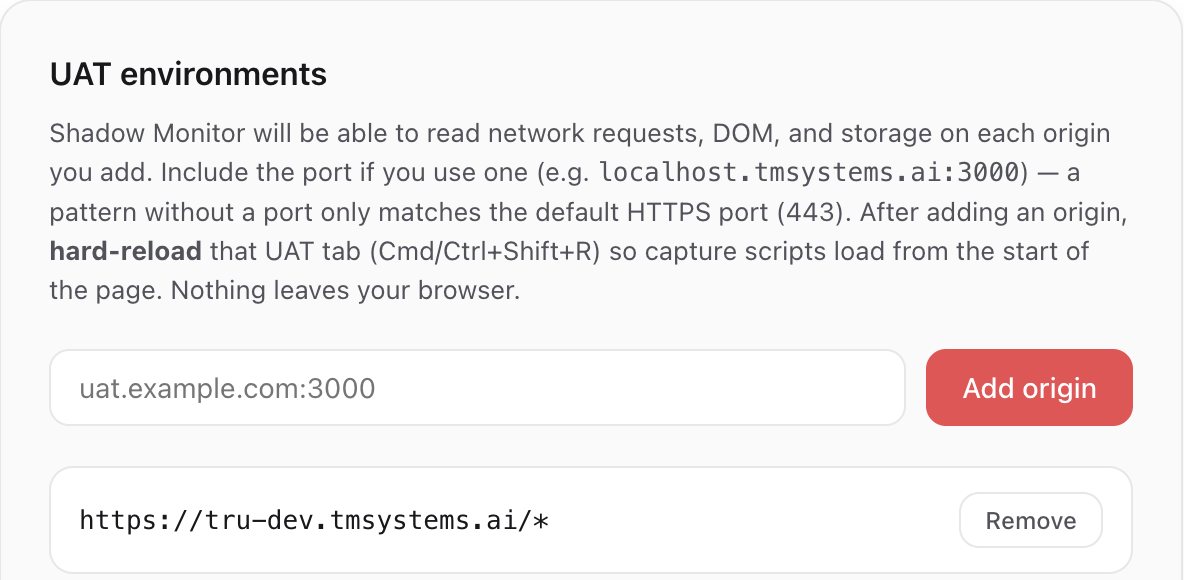
https://your-host/*.Grant every host you will use in the session — for example both a public UAT site and a separate CMS/Admin host. Capture is per origin pattern; a single grant does not cover other subdomains. After adding an origin, hard-reload that tab so scripts attach from the start.
Same-tab redirects between two granted origins (Admin → live site) stay in one recording; Download includes both in the rolling window. Network and console are also captured inside same-origin iframes (common in CMS admin UIs); DOM replay remains the top document.
Leave Capture / Downloads / Encryption at their defaults unless you need something special.
3 Hard-reload the UAT tab
Open your UAT site and hard-reload once so capture scripts load from the start of the page:
- Mac: Cmd+Shift+R
- Windows / Linux: Ctrl+Shift+R
4 Reproduce and download
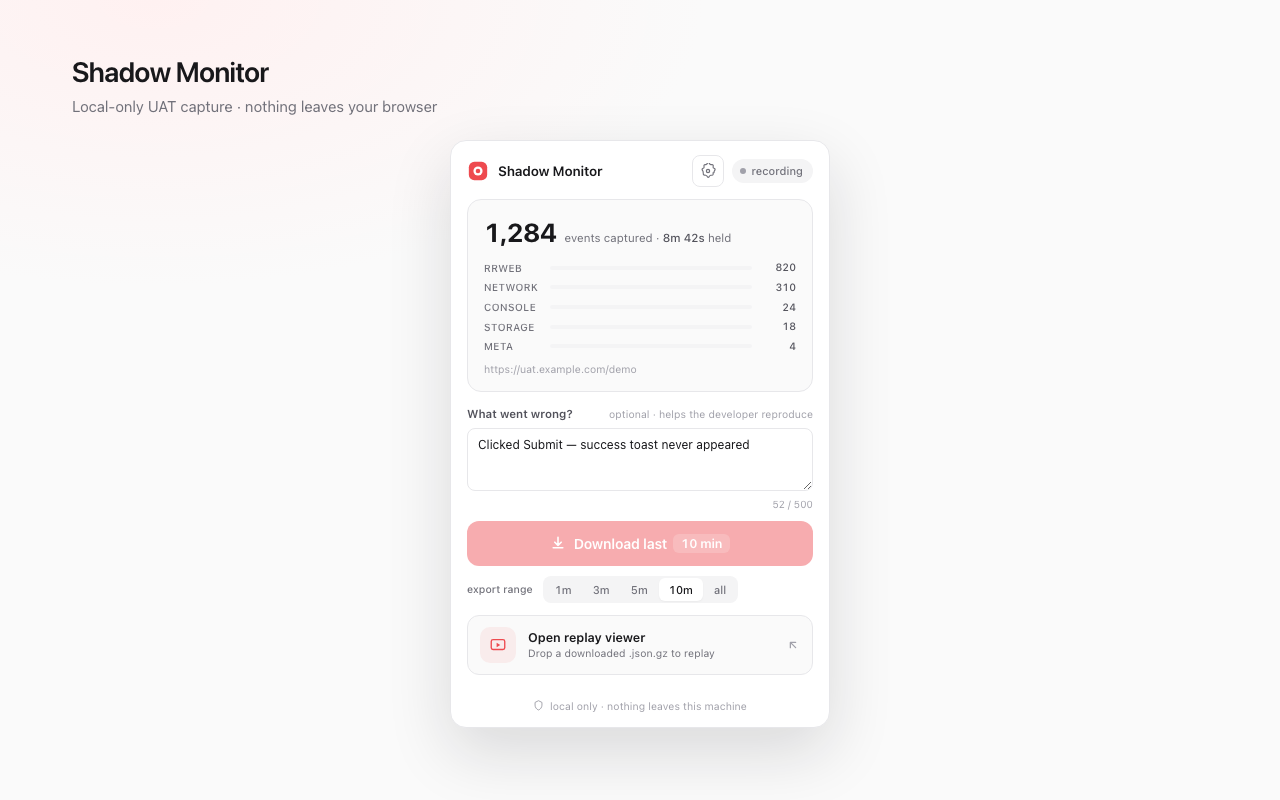
- Click the Shadow Monitor icon — status should show recording.
- Reproduce the bug as usual.
- Optionally describe what went wrong in the popup.
- Pick an export range (e.g. last 10 min or all) and click Download.
You get a uat-report-*.json.gz file in Downloads (or the folder you chose in Settings).
Nothing is uploaded — the file stays on your machine until you share it.
What “last N minutes” means
Download last N minutes is a wall-clock lookback on the tab where you open the popup — not “N minutes of continuous DOM playback.” Capture soft-pauses about 3 seconds after you leave that tab (other tabs, another window). While paused, no DOM / network / console events are written. Coming back resumes with a fresh full snapshot.
Example — you click Download last 5 min at 12:10:
- 12:00–12:02 — work on the UAT tab (recorded)
- 12:02–12:08 — other tabs (paused after ~3s; almost nothing written)
- 12:08–12:10 — back on UAT (recorded)
The export window is 12:05–12:10 on the clock. The first UAT stretch (12:00–12:02) is already outside that window. Inside the window you mainly get the ~2 minutes of activity from 12:08–12:10 — not five minutes of replay.
The popup shows recording time (active, un-paused) separately from buffer span (oldest→newest event timestamps). Prefer staying on the UAT tab while reproducing, and open Download on that same tab. Settings → Keep last is the rolling retention cap; a download range cannot exceed it.
5 Open the replay viewer
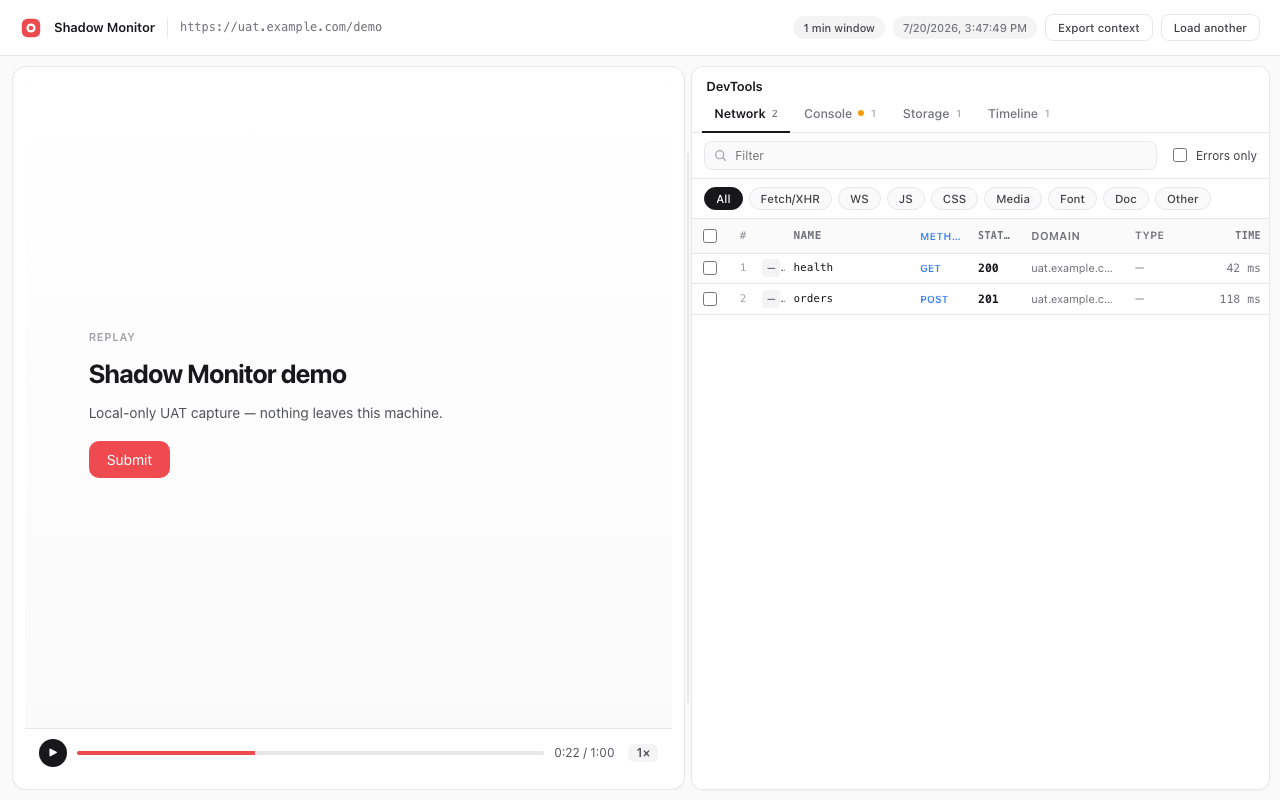
From the popup, click Open replay viewer, or open
viewer/viewer.html from the extension package. Drop the
.json.gz file onto the page to replay DOM, network, console, and storage.
Tips
- Each tab records in parallel. Download from the popup on the tab you care about.
- Background tabs soft-pause — see What “last N minutes” means if a download looks shorter than expected.
- Passwords, payment fields, and
.uat-mask/data-uat-maskstay masked in DOM replay. - Turn off Record input values or Capture cookies in Settings if you need a tighter buffer.
- Optional encryption (buffer on disk or encrypt-for-sharing) is in Settings — there is no passphrase recovery.
Need help? Contact support · Privacy policy